|
Simulation |
Description |
|
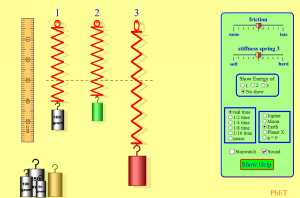
Masses and Springs |
Investigate
the oscillations of mass-spring systems. Complements work done
in the lab. Click here to
load.
|
|
WorldMaker |
A tool for
modelling probability-based or event-based scenarios. Click here to
download the installation file or click
here to run the file from the server. |
|
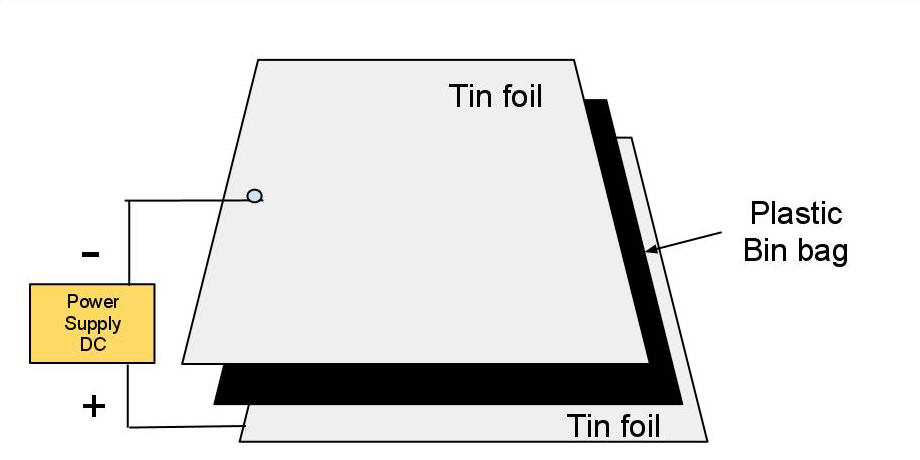
Giant Capacitor |
Your teacher will demonstrate
how to make a giant capacitor using tinfoil and polythene.
Try to explain what you see using your ideas about charges.
It is also helpful to look at a simulation of the way that
capacitors work in a circuit, using
the circuit construction kit.
 |
|
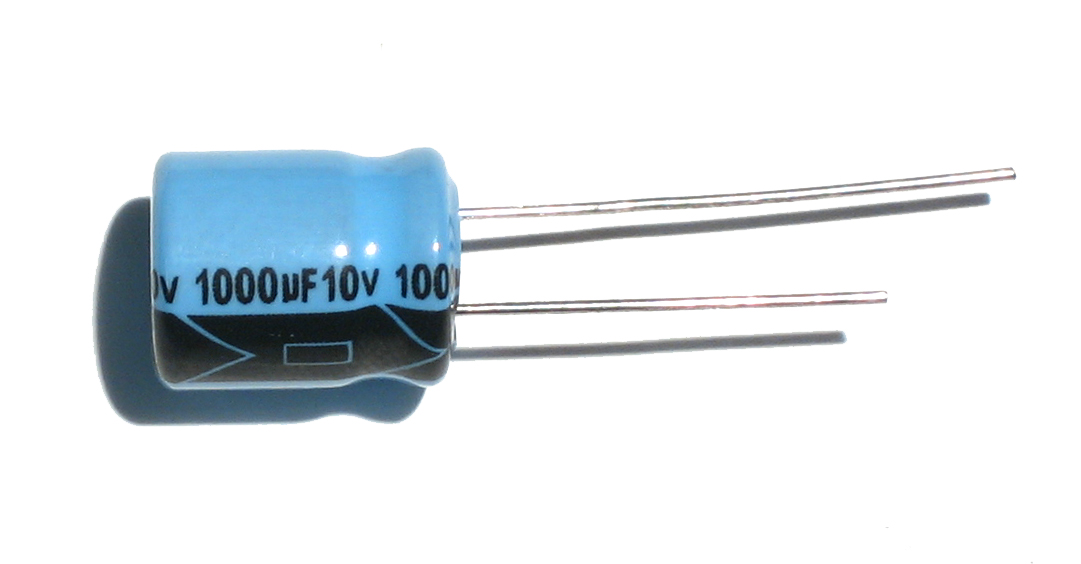
Capacitors and Exponentials |
Follow the
instructions here to
collect some data about the discharge of a capacitor. When you
have finished plot a graph of Voltage against time (you can use
Excel if you wish).
You
can now perform some simple analysis to see if the voltage
decreases as an exponential function.
• Plot
a Voltage time graph and check the half-life is constant.
•Plot a
graph of Ln(V) against t and see if it is a straight line. |
|
The Beer Experiment |
Follow the
instructions on
this sheet to take measurements of the head on a pint of
beer, as it decays. Is it an exponential funtion?
Let's find out!

SAFETY ADVICE:
You are using Tesco value lager or bitter, in a plastic
measuring cylinder. Do not drink it, as the soul-crushing
despair which will ensue is very likely exponential in nature.
Also, you are not legally allowed to drink. |
|
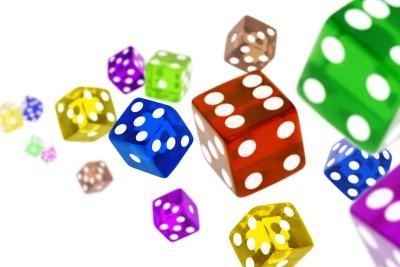
Decay of dice I |
Your teacher
will explain to you how to complete a practical activity -
observing rate of 'decay' of 'radioactive' dice. Record
your results in a spreadsheet and plot a graph of the results.
Does it follow an exponential pattern? Carry out a test to
see if it is exponential and use the formula given to calculate
the decay constant.
 |
|
Decay of dice II |
You are going to use excel to create a "model" of
the dice decay practical. Your teacher will explain the basic principles
to you. Extend your table to show 16 "iterations" and plot a graph of the
results. Use an exponential trendline to show the pattern followed by the
results. What differences do you notice between the results of the
experiment, and the theoretical model? You can see a completed copy of a
spreadsheet
here.
Once again, carry out a test to
see if it is exponential and use the formula given to calculate the decay
constant. |
|
Modelling Capacitance |
Your
teacher will explain how you can model the
discharge of a capacitor in excel using iterative methods.
There is an example of a completed model
here.
|
|
|
|
|
|
|
|
Nuclear decay equations - exponentials |
Complete
this starter question to demonstrate your understanding of
the analytical solution for radioactive decay. |
|
Modelling Exponentials |
look at this
spreadsheet to
see how the number of iterations effects our estimate of the
expected decay time of a sample of radioactive atoms. |
|
Capacitance calculations |
Formula sheet -
charge and capacitance including analytical solutions.
Question sheets:
Q60S - Charging capacitors
Q70S - Capacitor Discharge and Time Constants
Q110S - Energy Stored by Capacitors
Q140S - Capacitors with the Exponential Equation |
|
Lancaster particle physics
software |
Look at this
software, (there will likely be a worksheet to go with this at some point...!) |